Takion Technologies Scan Engine

42 scans · 17 raw feeds · full US equity universe

Every other screener is reading a summary.

Retail scanners run on the consolidated tape — last price, last size, aggregate volume. Takion takes seventeen raw exchange feeds direct, so its screener filters on things the tape doesn't carry: net bid and ask pressure at the quote, NYSE and Nasdaq auction imbalance, borrow cost, tick repetition, distance to the halt band. This library turns that into 42 named scans.

What a scan looks like when the data is real

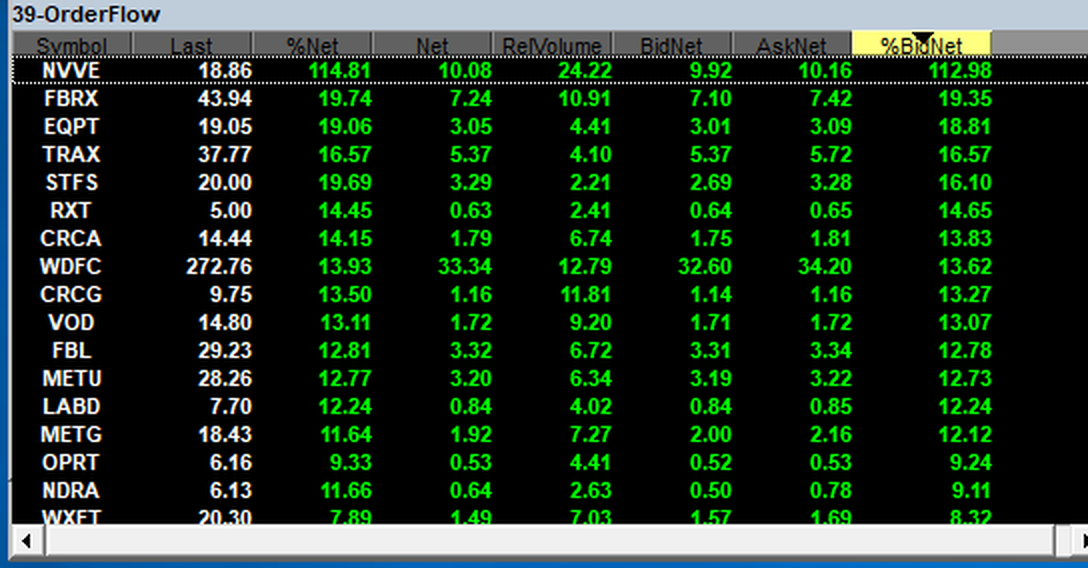
This is 39-OrderFlow at 09:36. BidNet and AskNet are net order-flow pressure read at the quote — not derived from candles, not inferred from price action. No screener running on the consolidated tape can produce this column, because the tape does not contain it.

39-OrderFlowsorted %BidNet desc
Takion market sorter window titled 39-OrderFlow, listing symbols with columns for Last, %Net, Net, RelVolume, BidNet, AskNet and %BidNet, sorted by %BidNet descending
BidNet · AskNet · %BidNet. Book-level buying and selling pressure, ranked across every listed symbol in real time.
01-HOD Volsorted VolRate desc
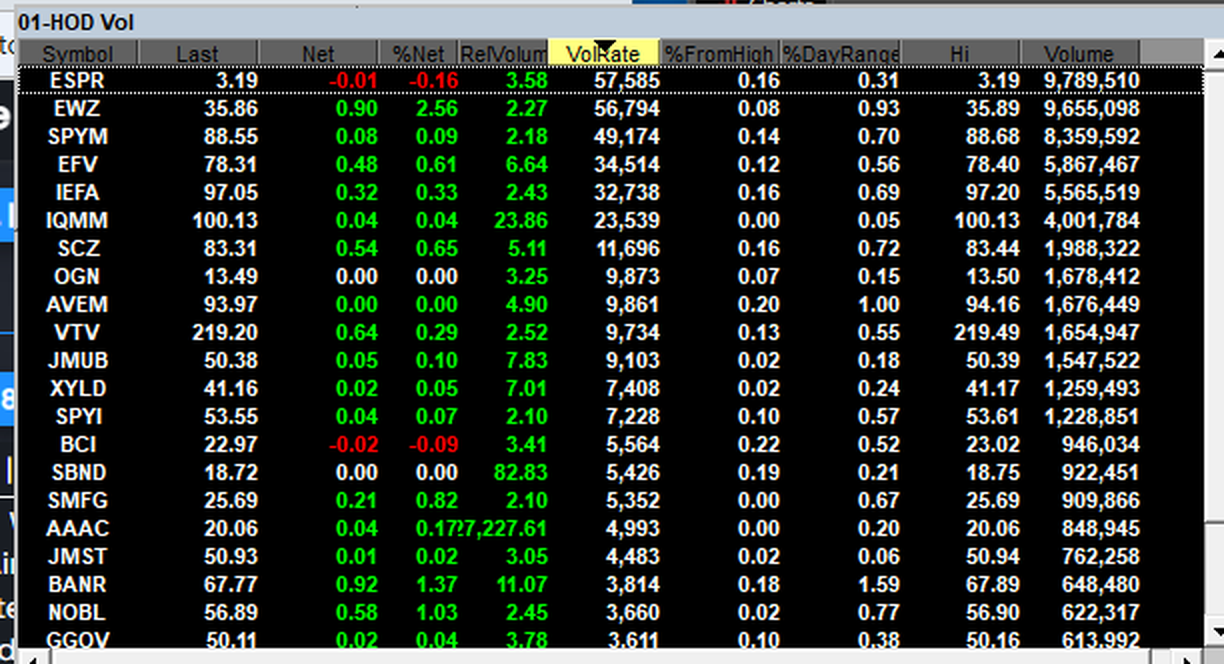
Takion market sorter window titled 01-HOD Vol showing symbols at new highs with columns for Last, Net, %Net, RelVolume, VolRate, %FromHigh, %DayRange, Hi and Volume
VolRate · %FromHigh · %DayRange. New highs ranked by the rate volume is arriving, not by how much has arrived.

What you see when you log in

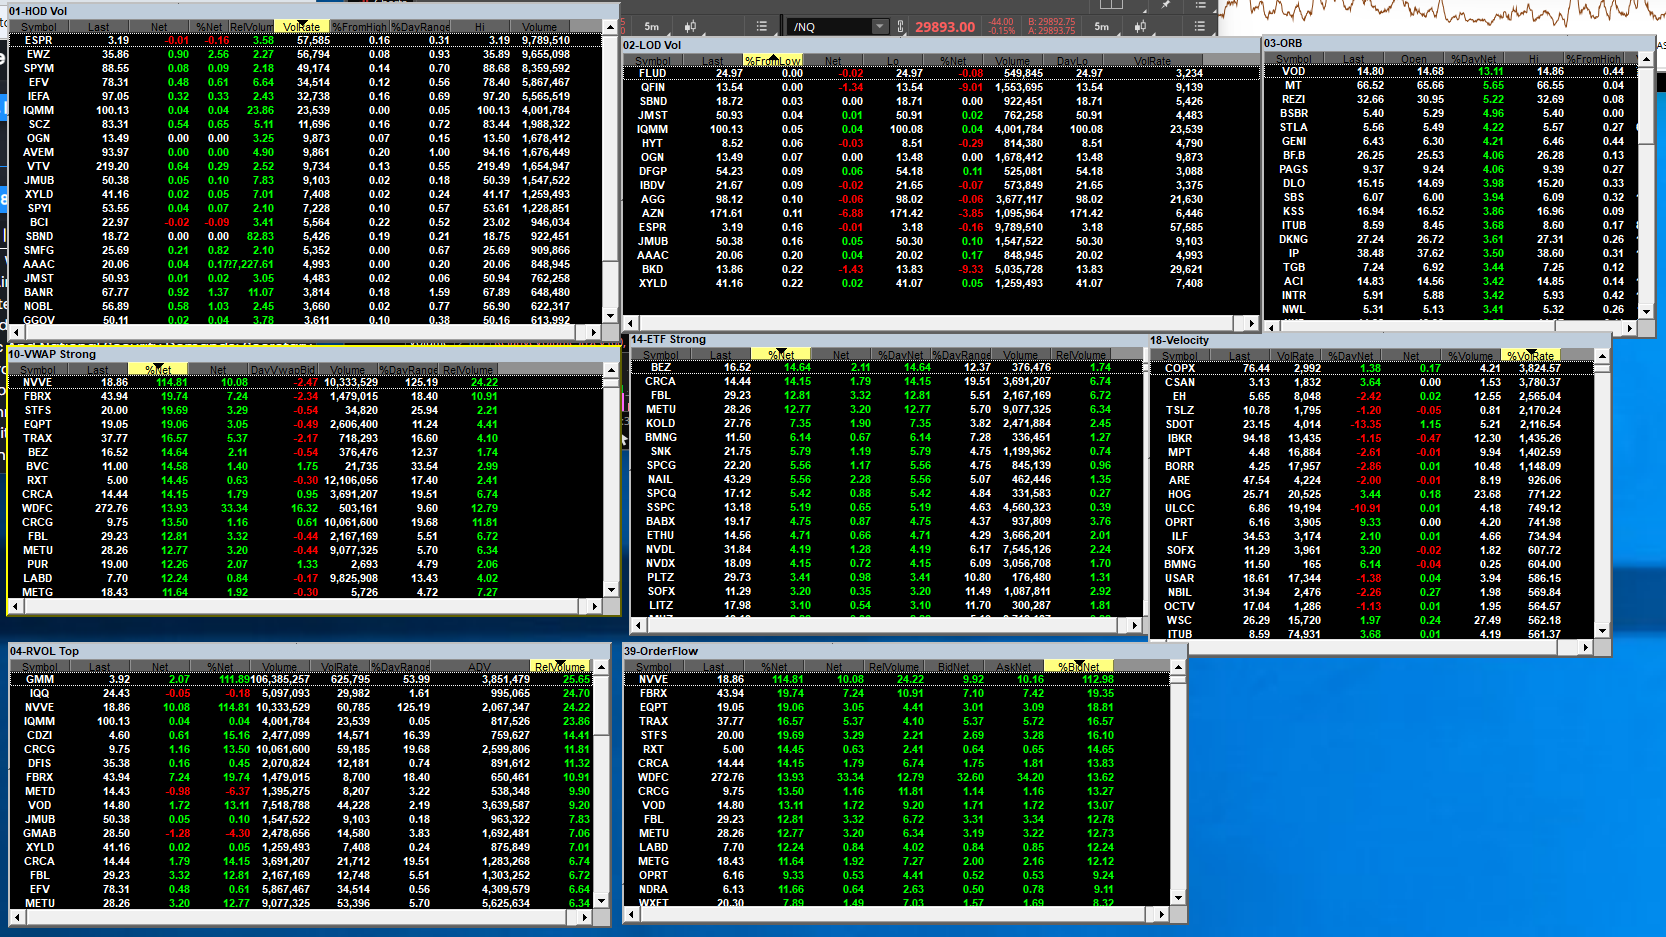
Not a dashboard. Not a card layout. Windows of live numbers, each one filtering the entire listed universe and re-ranking on every print. This is one workspace, mid-morning.

trader-intel · scan workspacelive · full market
Takion workspace with eight market sorter windows populated with live scan results, covering high of day, low of day, opening range, relative volume, VWAP strength, ETFs, velocity and order flow
Eight scans, one screen. High of day, low of day, opening range, relative volume, above-VWAP strength, ETF rotation, velocity and order flow — every one reading the whole market at once.
04-RVOL Topsorted RelVolume desc
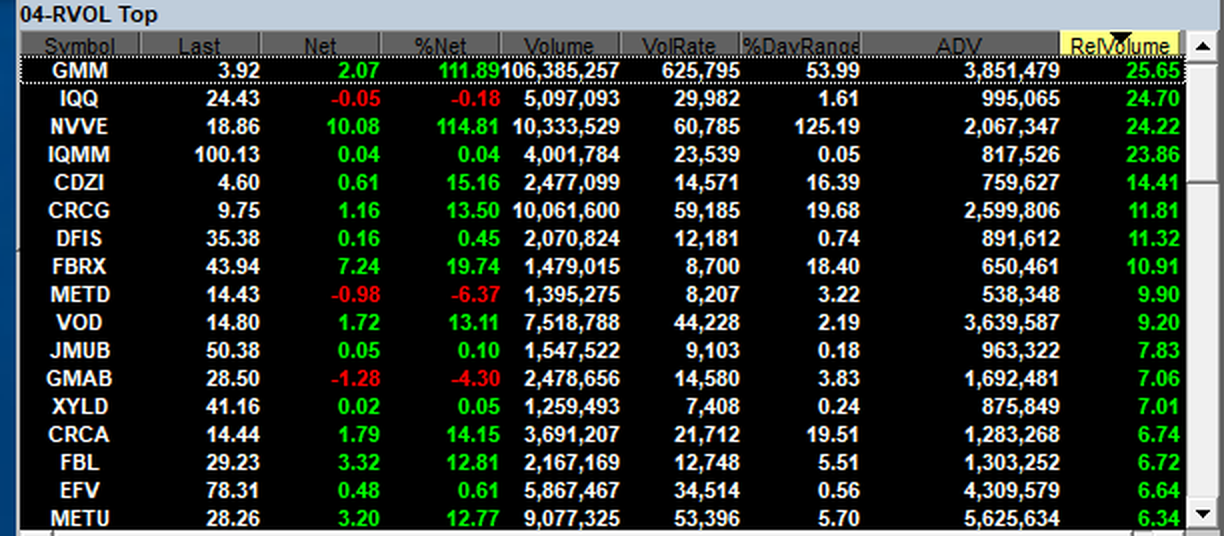
Takion sorter 04-RVOL Top ranking symbols by relative volume with Volume, VolRate, percent day range and average daily volume columns
RelVolume against ADV. The multiple and its baseline side by side, so a 25x reading on a thin name reads as thin rather than as a signal.
18-Velocitysorted %VolRate desc
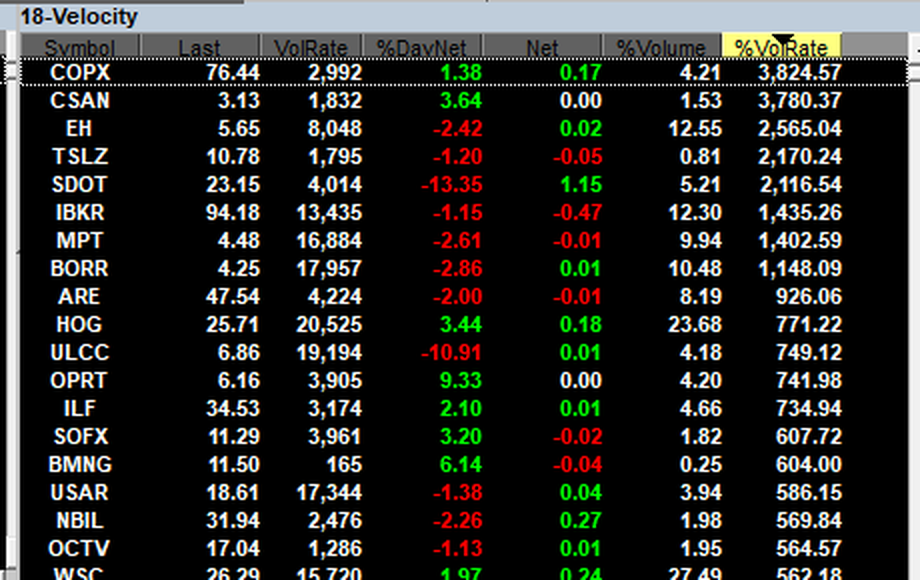
Takion sorter 18-Velocity ranking symbols by volume rate on a rolling intraday window
Rate over a rolling window. Not what traded today — what is trading right now, in the last few minutes.

Seventeen feeds, taken raw

Takion's servers sit in the Equinix NY4 facility beside the exchange matching engines and ingest these feeds directly. Everything the screener can filter on comes from this list — which is why the field set has no equivalent at retail pricing.

Level 1 — UQDF / UTDF
CQS / CTS
Nasdaq TotalView
Nasdaq BX TotalView
Nasdaq PSX TotalView
NYSE Imbalances MOC / LOC
NYSE OpenBook
NYSE Trades
NYSE Alerts halts
NYSE Amex OpenBook
NYSE Arca Book
NYSE Arca Trades
BATS BZX Depth
BATS BYX Depth
EDGX Depth of Book
EDGA Depth of Book
NSX Depth of Book

Depth-of-book feeds from six venues are what make bid and ask net pressure computable. NYSE Imbalances is what makes the closing-auction scans possible. Neither exists on the consolidated tape.

The field-by-field comparison

Every mainstream retail screener derives its filters from the same consolidated feed. The differences between them are interface and alerting. The difference here is the input.

Filter field Takion Consolidated-tape screeners
Price, volume, % changeyesYes — this is where the overlap ends
Relative volumeyesYes, computed from tape volume
Net bid / net ask pressureyesnot available — requires depth of book
NYSE closing-auction imbalanceyesnot available — separate exchange feed
Nasdaq imbalance, near / match priceyesnot available
Tick count and tick repeat countyesnot available — needs every print, not a summary
Borrow status and borrow costyesusually a separate locate product
Distance to LULD halt bandyesrarely surfaced
Live exchange trading stateyesrarely surfaced
VWAP distance, bid and ask sides separatelyyesSingle signed VWAP distance at best
Rolling intraday window on any filteryesFixed intervals, usually
Why this is structural, not a feature gap. A competitor cannot ship these fields with a software update. Depth-of-book and imbalance feeds have to be licensed from each venue and processed at the exchange, which is a data-infrastructure decision made years upstream of the product.

Tick data is the part nobody else has

The consolidated tape gives a screener aggregated volume. It does not tell you how that volume arrived. Takion sees every print, so the screener can filter on the shape of the tape rather than its total.

Tick Count

How many prints, not how many shares

A million shares in forty prints is an institution working an order. A million shares in four thousand prints is a crowd. Same volume, opposite meaning, and only one of them is visible on the tape.

Tick Repeat Count

Absorption before it shows in price

The same price printing over and over means a resting order is absorbing everything hitting it. That level breaks or it reverses — and either way you knew about it before the candle closed.

VolRate

Rate, not accumulation

Volume tells you what already happened. Rate of volume tells you what is happening right now. Sorting a new-high scan by rate surfaces the move that is starting rather than the one that is finished.

Bid Net · Ask Net

Which side is actually paying

Net pressure at the quote separates buyers lifting the offer from sellers hitting the bid. Price can be flat while one side is being quietly taken out.

%PreMhVol / ADV

Pre-market volume against normal

A gap on twice its average daily volume before the open is a different animal from a gap on nothing. This is the field that separates a real episodic pivot from a quiet drift.

push feed

No refresh interval

Web screeners poll on a timer. This one updates when the print happens. There is no window in which your scan is showing you the previous minute.

one data plane

You trade what you screened

The scan, the montage and the order router read the same book. With a screener from one vendor and a broker from another, they never quite agree.

Rolling window

Any filter, last five minutes

Every field above can run on a rolling intraday window instead of the session. That is what makes velocity, tick surge and short-horizon order-flow scans possible at all.

A professional instrument, not a product tour

The filter panel exposes roughly two hundred fields on one screen. No wizard, no onboarding carousel, no AI assistant guessing at your intent. It assumes you know what you are looking for and gets out of the way.

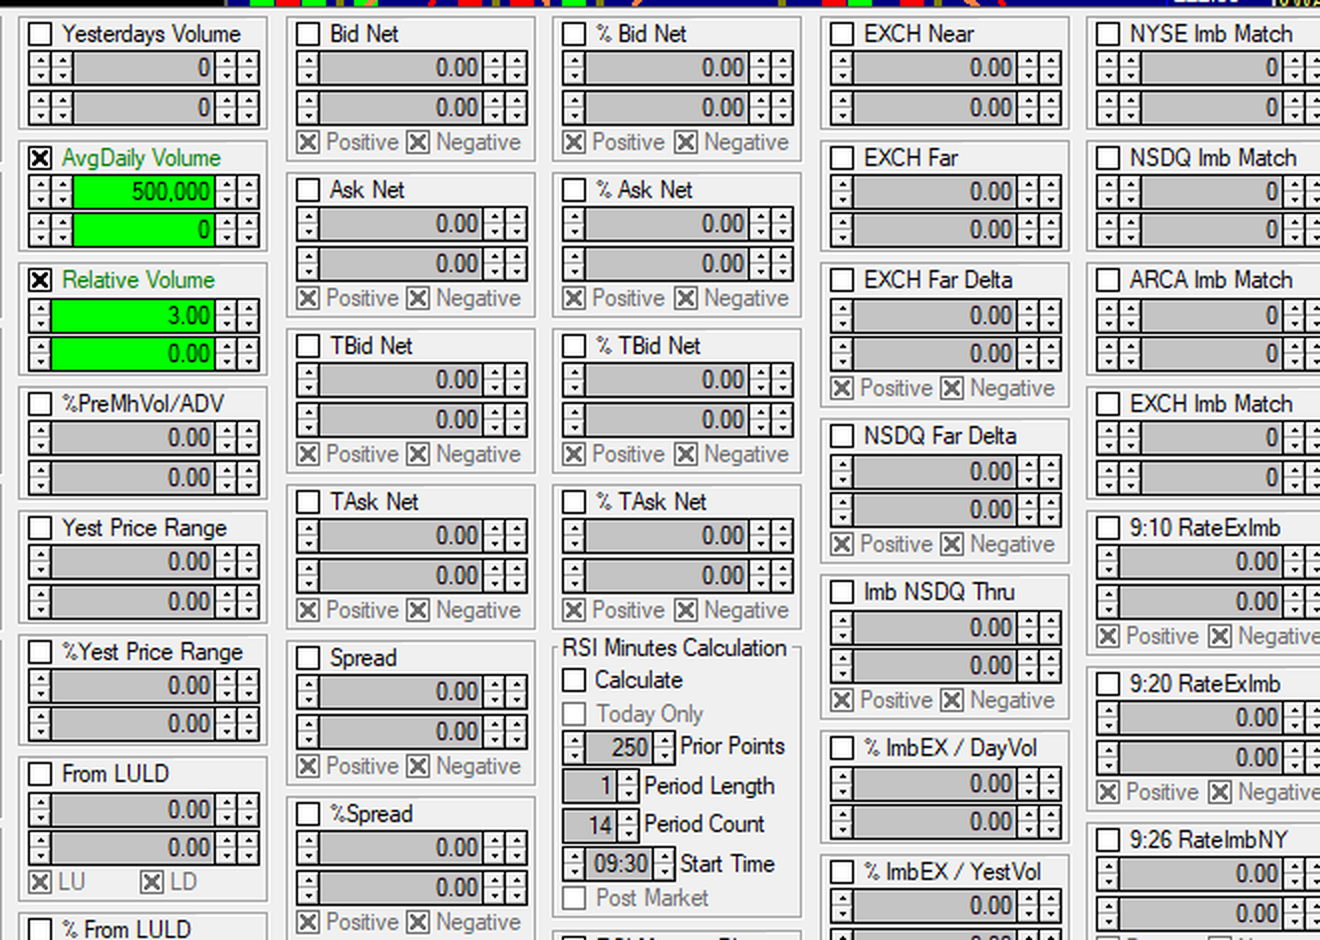
Filter · 04-RVOL Topdetail
Close detail of Takion's market sorter filter panel showing dozens of numeric filter fields for imbalance, bid net, ask net, spread, VWAP and RSI values
One quadrant of one filter panel. Imbalance, bid and ask net, spread, VWAP distance and RSI — every field independently bounded with min and max, every one composable with the rest.

The Bloomberg comparison is the right one

A Bloomberg terminal is dense, unfriendly to a newcomer, and completely unapologetic about it. It is designed for someone who uses it eight hours a day and values a second saved over a pixel polished. Takion's sorter is built on the same premise.

Density is the feature

Forty-two scans fit on one screen because the windows carry no chrome, no padding, no illustrations. You see the whole market's behaviour in one glance instead of clicking between tabs.

Nothing is guessing on your behalf

There is no scoring model deciding which alerts you deserve. You write the conditions, the engine applies them to every symbol, and the ranking is whatever column you clicked. What you see is the data, not an opinion about the data.

Forty-two scans, twelve families

Each scan names a specific setup and ships with its filters, columns and sort already configured. Ten of them are only possible on this data.

42configured scans, one layout
17raw feeds behind them
10impossible on consolidated data
~200filter fields available
01–03
Momentum breakouts — high of day, low of day, opening range
04–06
Relative volume — leaderboard, VWAP approach, trend location
07–09
Tick count and repeat — surge, absorption, divergence
10–11
Trend following — above-VWAP strength, daily RSI continuation
12–13
Mean reversion — oversold bounce, stretched-from-VWAP fade
14–16
Sector rotation and index relative strength
17–18
Scalping — tight-spread liquid names, velocity spikes
19–20
Swing long — pullback in uptrend, base breakout with range expansion
21–22
Swing short — failed high, hard-to-borrow breakdown
23–26
Reversals, gaps and cross-cutting staples
27–32
Named methodologies — Qullamaggie continuation and EP, Stockbee 4% and tight consolidation
33–42
Order flow, auction imbalance, spread blowout, borrow squeeze, halt proximity

It lives inside the desk

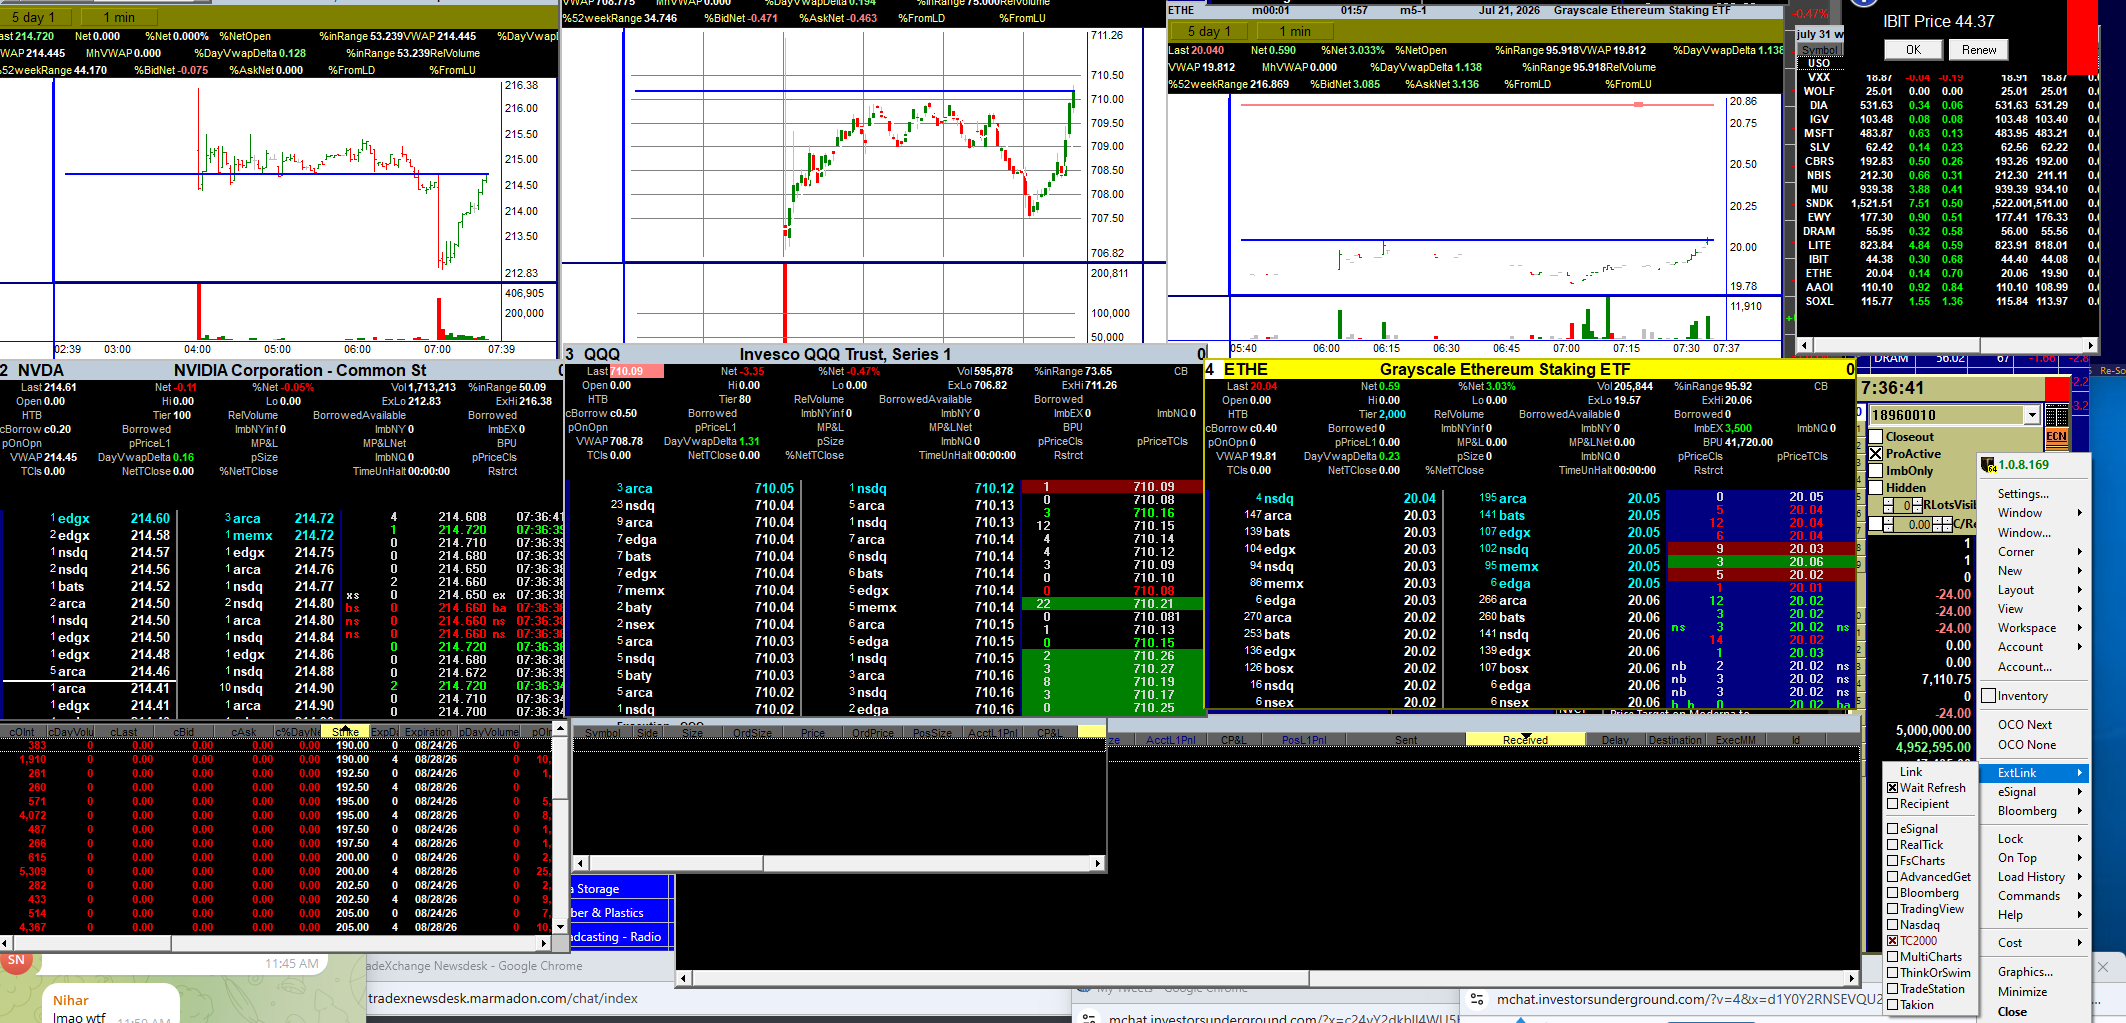
The scans are not a separate window you alt-tab to. They share a layout with Level 2, charting, order entry and the position blotter, and they push symbols out to external charting through the link menu.

Layout · sorters, Level 2, charts, order entryNVDA · QQQ · ETHE
Full Takion desktop with three charts, three Level 2 montage windows, an execution blotter, a watchlist and the external link menu open
A scan surfaces the symbol, the montage shows the book, the chart link fires, the order goes out. The whole loop stays on one screen.

Getting a seat is a market data question first

Direct exchange feeds require subscriber agreements with each venue, and your professional or non-professional status determines what you pay. Both are covered before anything gets installed.